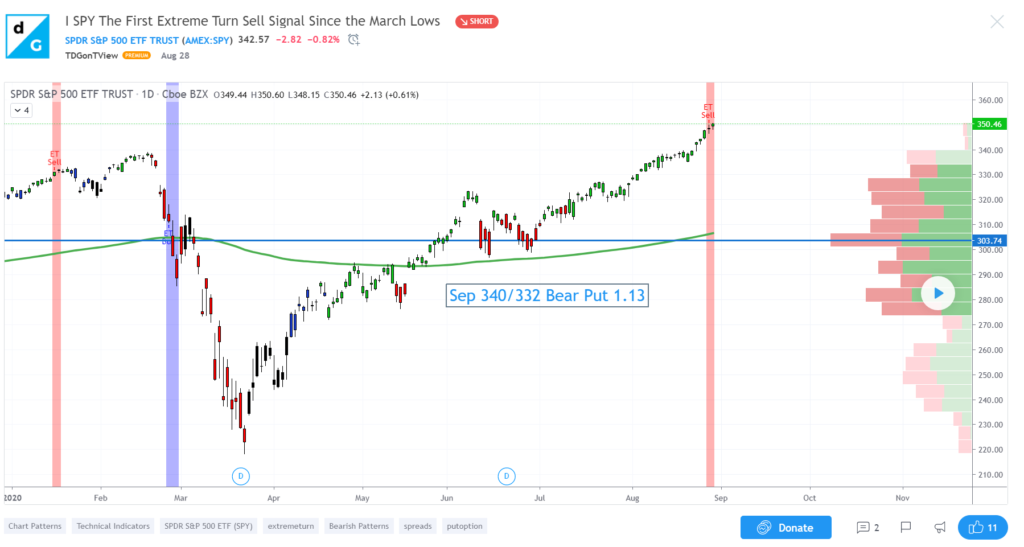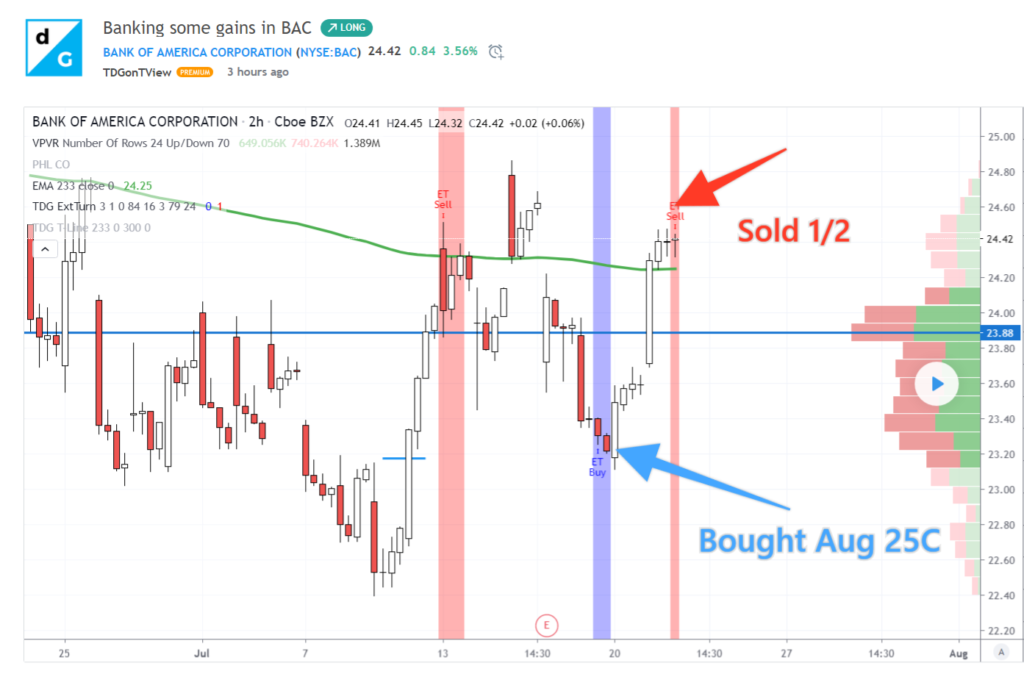
On August 28 we posted an idea to our TradingView page and Telegram Channel highlighting the first sell signal on a daily time frame that we’ve seen from the Extreme Turn (Money Points) hybrid indicator in the S&P (/ES, SPY, SPX) since the March lows.
In the post, we highlighted that there was nothing bearish about the chart, but that markets will tend to “look” the most bullish (or bearish) at potential turning points. Of course, the look of the chart at the time had nothing to do with our reason for entry. It was just some color for the commentary. We bought put spreads because we had a short entry signal, the first in over 5 months as the title of the idea indicates.
At TDG, we use hybrid indicators and extensive backtesting, to determine indicator settings that make guessing or looking for signals, set-ups, and price areas of interest a simple process of waiting for software to tell us to do something. We do this because, you know, there is another adage that come sto mind. Looks can be deceiving. Oh so true in trading wouldn’t you say?
Here is the idea from TradingView along with all our exits and trade management from entry.
I SPY The First Extreme Turn Sell Signal Since the March Lows by TDGonTView on TradingView.com
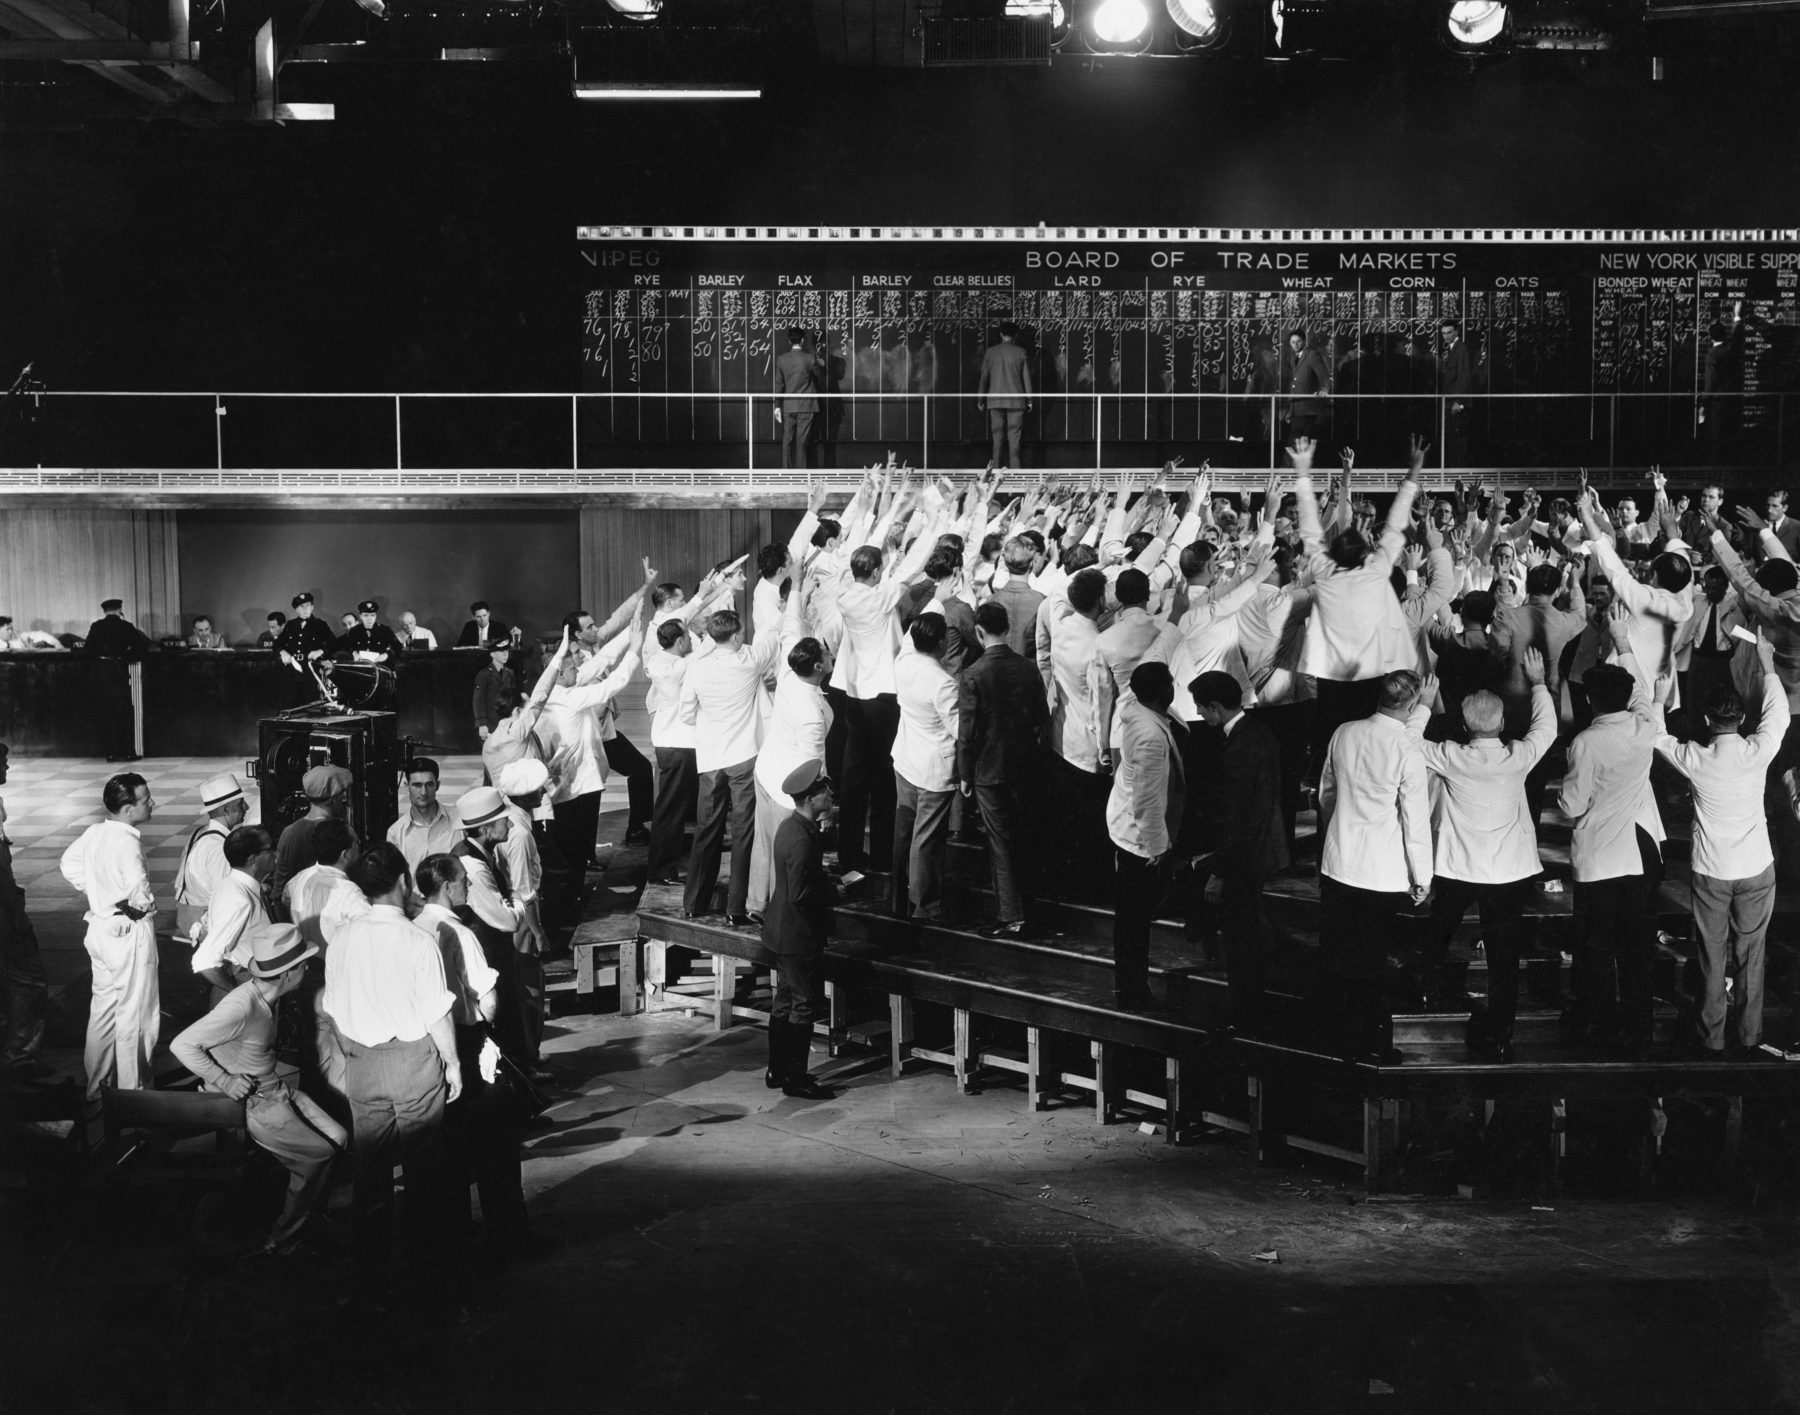
We can keep this one pretty simple. It’s day #2 with an Extreme Turn sell/short on the SPY daily timeframe . The prior day was the first sell signal in the entire move since the March lows. There is absolutely nothing bearish looking in this chart. That said, we recall our adage at TDG – Markets’ always look the most bullish at the tops.
We’re expressing the signal with a $8 wide Bear Put – SPY SEP 340/332.
As always, our risk is 50% of the premium paid so we’re looking at risking about .60 to make $6+
Submitted Order Type Limit @ 1.15 Debit
Bought 15 SPY 09/18/20 Put 340.00 @ 3.03
Filled at: Aug 28, 2020 3:08:10 PM EDT
Sold 15 SPY 09/18/20 Put 332.00 @ 1.88
Filled at: Aug 28, 2020 3:08:10 PM EDT
We’ll see if our patience pays?
Sep 3 |Trade active: Scale partial $1.5
Sep 3 |Trade active: Scaling more $2.40 100%+ winner
Sep 3 |Comment: Keep in mind price is still not at the short strike.
Sep 5 | Trade closed: target reached: Late update given the very active trading Friday. Closed the remainder of position at $4.20cr. You said 420!
Trade Like You Mean It!
Subscribe to TDG on YouTube
Follow TDG at TradingView
Commodity Futures Trading Commission. Futures and Options trading has large potential rewards, but also large potential risk. You must be aware of the risks and be willing to accept them in order to invest in the futures and options markets. Don’t trade with money you can’t afford to lose. This is neither a solicitation nor an offer to Buy/Sell futures or options. No representation is being made that any account will or is likely to achieve profits or losses similar to those discussed on this web site. The past performance of any trading system or methodology is not necessarily indicative of future results.
CFTC RULE 4.41 – HYPOTHETICAL OR SIMULATED PERFORMANCE RESULTS HAVE CERTAIN LIMITATIONS. UNLIKE AN ACTUAL PERFORMANCE RECORD, SIMULATED RESULTS DO NOT REPRESENT ACTUAL TRADING. ALSO, SINCE THE TRADES HAVE NOT BEEN EXECUTED, THE RESULTS MAY HAVE UNDER-OR-OVER COMPENSATED FOR THE IMPACT, IF ANY, OF CERTAIN MARKET FACTORS, SUCH AS LACK OF LIQUIDITY. SIMULATED TRADING PROGRAMS IN GENERAL ARE ALSO SUBJECT TO THE FACT THAT THEY ARE DESIGNED WITH THE BENEFIT OF HINDSIGHT. NO REPRESENTATION IS BEING MADE THAT ANY ACCOUNT WILL OR IS LIKELY TO ACHIEVE PROFIT OR LOSSES SIMILAR TO THOSE SHOWN.


